Performance Troubleshooter
In
the Toolbox, directly beneath the Performance Monitor is a tool called
the Performance Troubleshooter. This can be a monitoring tool or a
troubleshooting tool, depending on what it is you are concerned about
with your Exchange server. It can even assist with solutions to your
problems or performance issues.
To use the Performance Troubleshooter, perform the following steps:
1. | Open the EMC.
|
2. | From the Navigation Tree, select Toolbox.
|
3. | Scroll down to the Performance tools, select Performance Troubleshooter, and then from the Actions pane, select Open Tool.
|
4. | You
are first taken to the Update the Exchange Troubleshooting Assistant.
If no updates are needed, select the Go to the Welcome Screen link.
|
5. | You
are asked to label the analysis that will be performed. Then select
either the option Troubleshoot New Performance Issue or the Analyze
Previously Collected Data option. If this is your first time looking at
Performance Troubleshooter, you want to choose Troubleshoot New
Performance Issue. If you have an analysis you want to view, choose
Analyze Previously Collected Data. Then click Next.
|
6. | You are asked, “What symptoms are you seeing?” and you can choose one of the following:
- Multiple users are complaining of delays while using Outlook or are seeing the Outlook cancellable RPC dialog frequently.
- The number of RPC operations per second is higher than expected.
- The number of outstanding RPC requests is high.
|
7. | Make a choice depending on the problems you notice, and click Next.
|
8. | You
are asked for a Server Name. The Global Catalog Server Name is usually
filled in by default. You can Show Advanced Login Options and alter the
credentials to be used. Then click Next.
|
9. | In
the Configure Data Collection section, there are many options. You are
shown the root-data directory and you can start the collection
immediately or set a scheduled time. If you show advanced data
collection options, you can turn on or off settings such as the
following:
- Collect PerfMon Data
- Collect ExMon Data
- Collect Function Call Log (FCL) Data
- Collect Event Log Data
|
10. | Review the options, make the changes you prefer, and click Next.
|
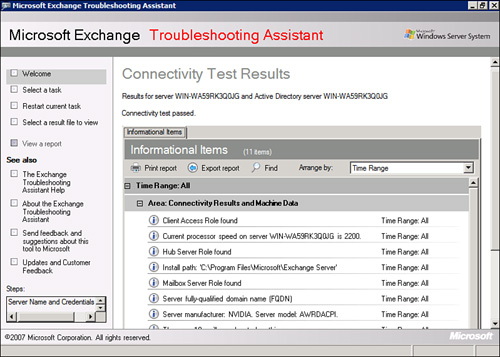
11. | The analysis is performed and the Connectivity Test Results page is displayed, as shown in Figure 6.
|
Note
ExMon
is the Exchange Server User Monitor, a tool that was developed to
collect performance data regarding Outlook (MAPI) clients and their
performance. Unfortunately, it is not easily obtained for Exchange
2007. It seems you have to open a support incident with Microsoft or be
an MS Gold Partner to obtain the tool.
Now
you can perform the analysis of the gathered data, either immediately
or by restarting the process at a convenient time. To do so, perform
the following:
1. | From the Connectivity Test Results page, click Next.
|
2. | The
files are read and analyzed. In the end, you are presented with a
Performance Summary tab, a Performance Details tab, and an
Informational Items tab.
|
3. | The tool offers to investigate user activity. Click Next.
|
4. | You
are presented with a variety of options from which to choose. For
example, if high RPC is found on the server, there could be a
third-party Outlook add-in to blame, so you are asked to provide
additional information regarding the users of the server. Then click
Next.
|
5. | Your system will check the following items:
- Disk drives
- Location of the data files
- Health of the physical disk
- Queue performance
- LDAP health
- Network performance
- Miscellaneous checks
- ExMon RPC analysis
- FCL analysis
|
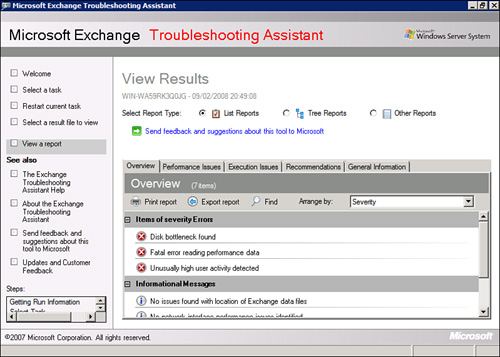
6. | You
are finally presented with a final set of results with the Overview of
all items, Performance Issues, Execution Issues, Recommendations, and
General Information, as you can see in Figure 7.
|
7. | You
can change the report type from List Reports to Tree Reports or Other
Reports. You can see the various issues and print the report, export
the report, use the Find option to locate something specific, or
arrange by severity or issue.
|
This
tool can be used for troubleshooting, but it is better to use it for
monitoring and reporting first. Fix the problems before they grow too
large.